logo UGent

Follow the Weather in Ghent with MOCCA stations

Update 05/02/18: Frost duration 40% lower in center of Ghent

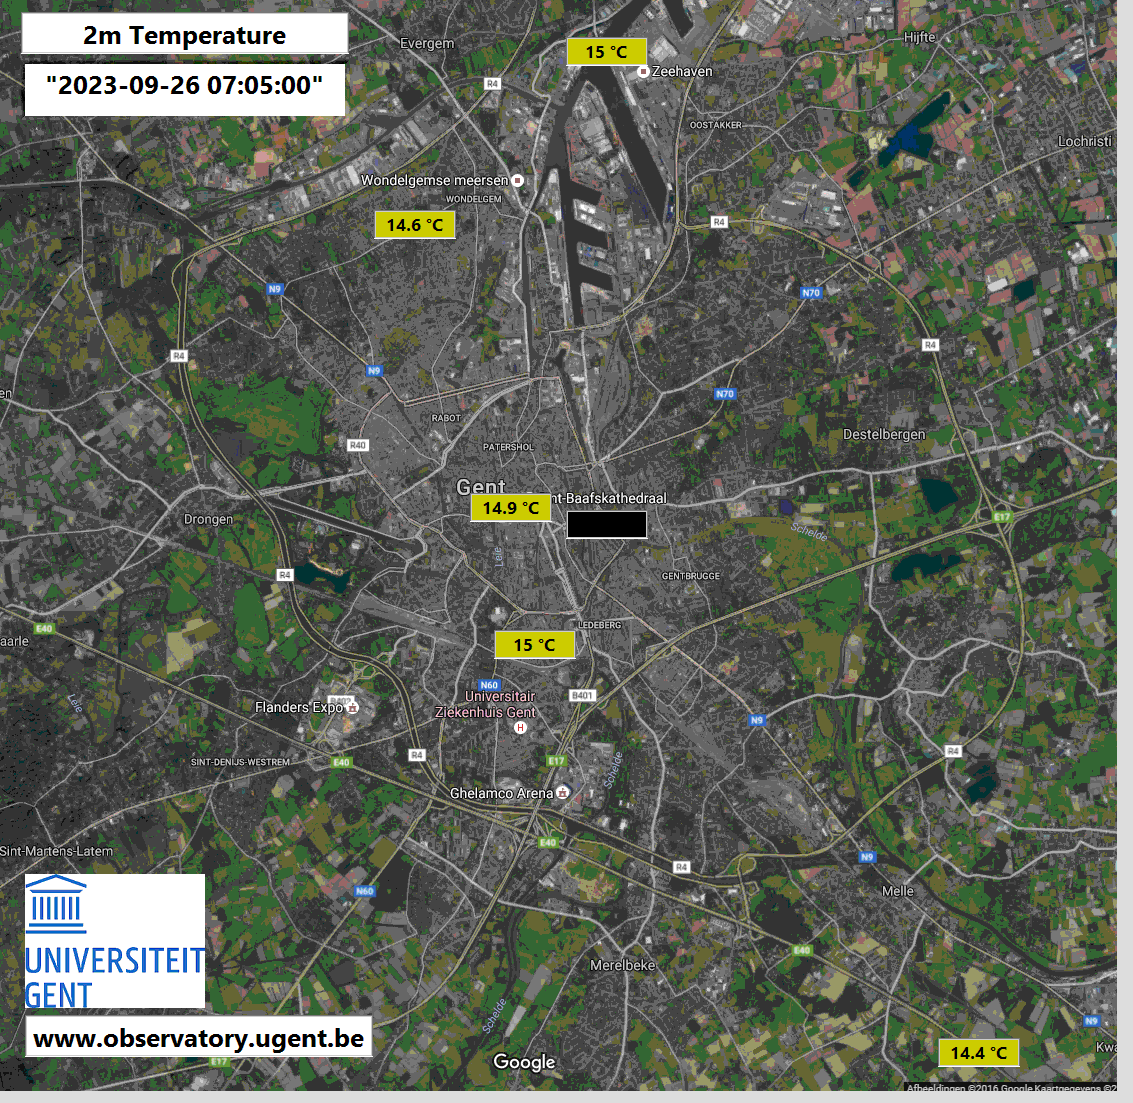
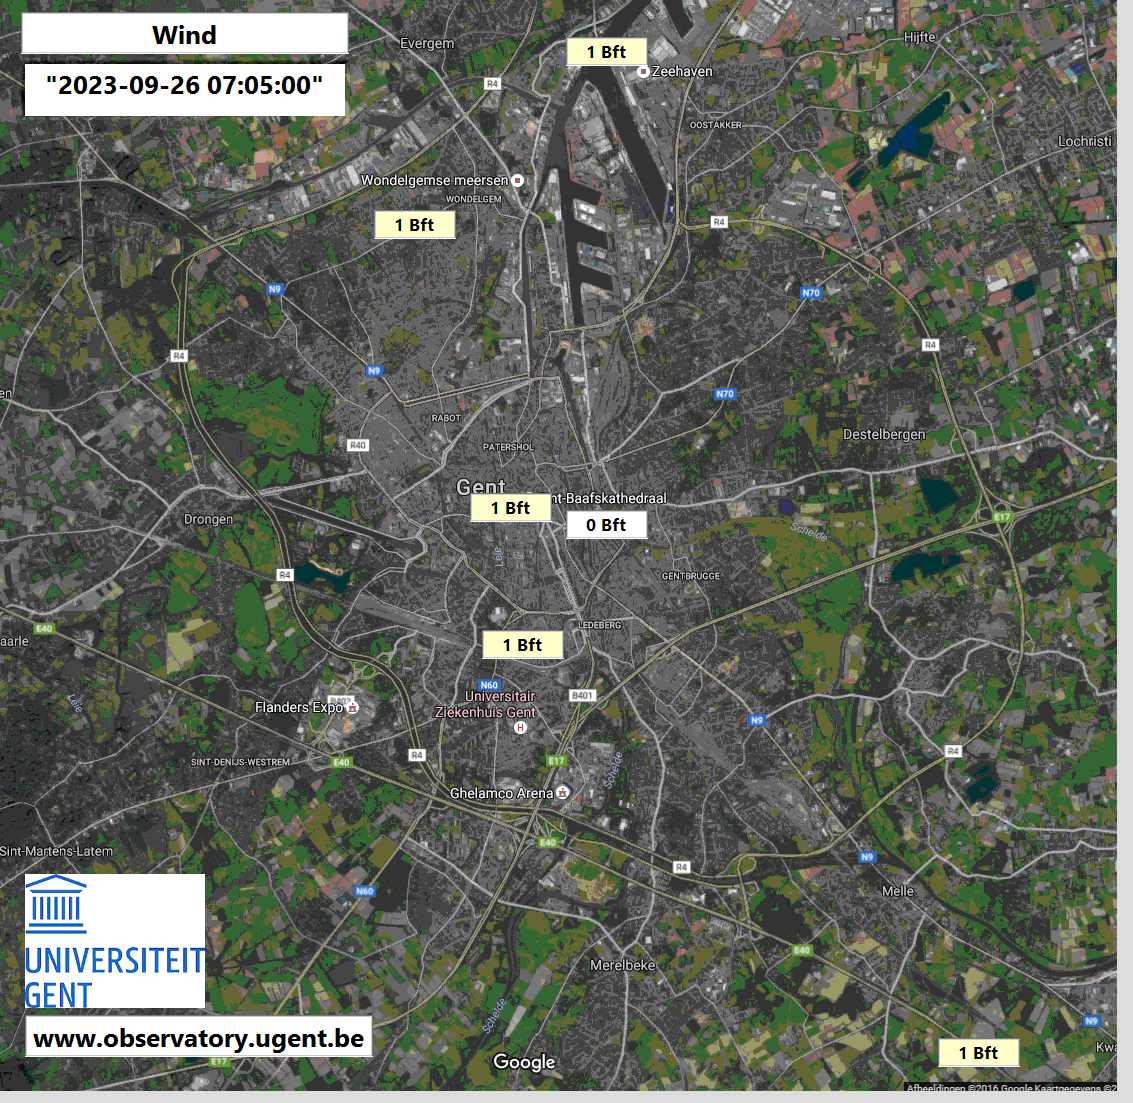
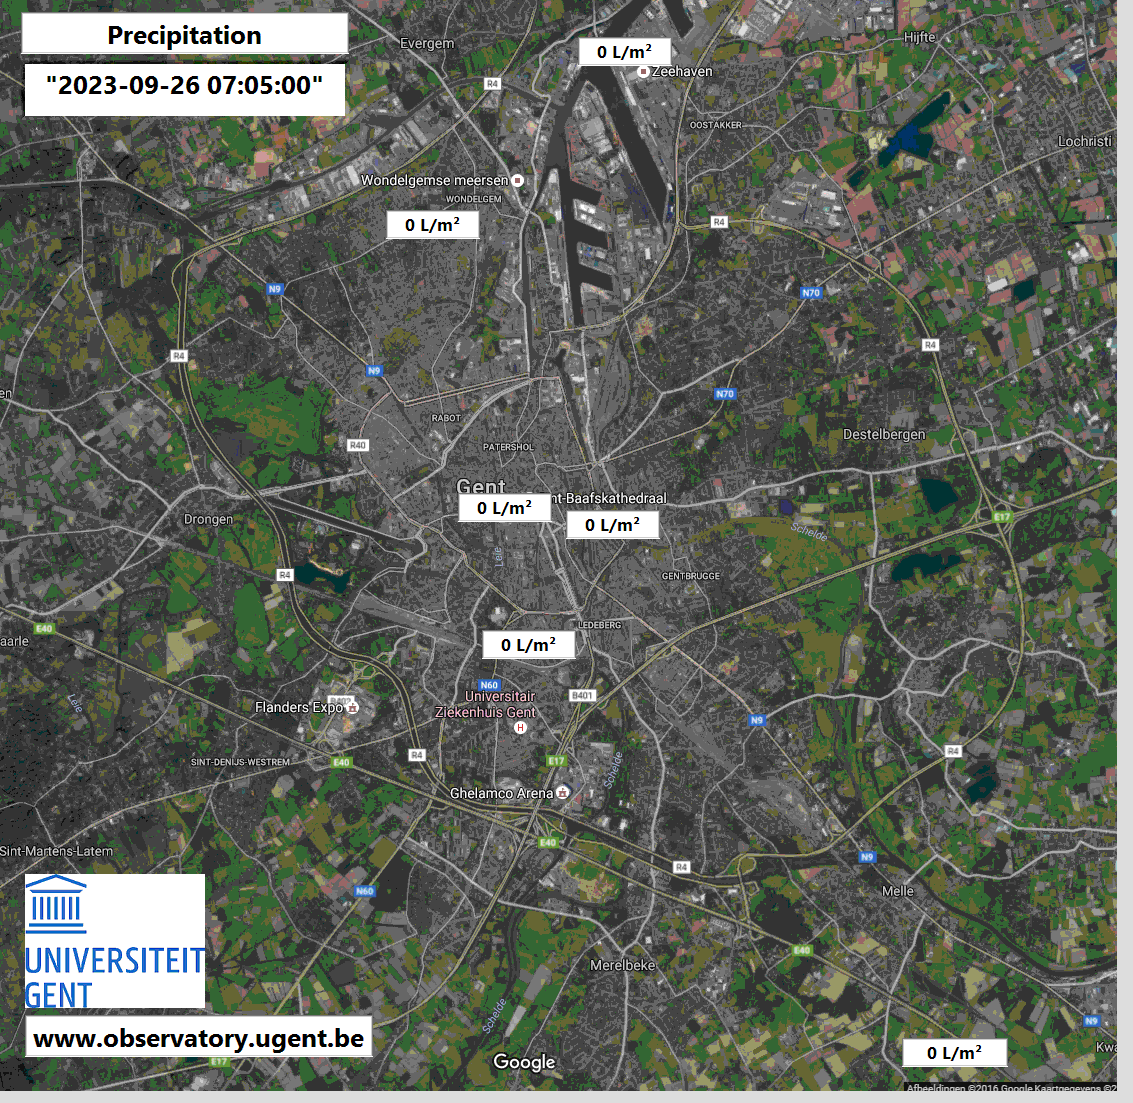
Geographical location of stations

Locations Gent Map
Overview of the locations of the 6 weather stations.
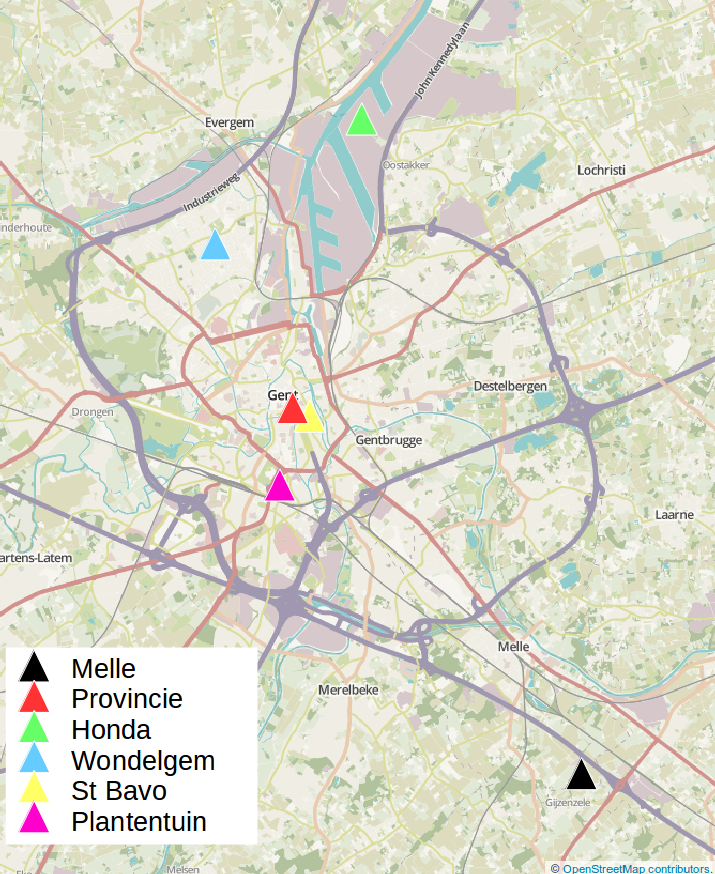
This map shows the city of Ghent and the locations of the 6 weather stations. The stations are installed in different urban environments:
  • Locations Provincie and St Bavo are situated close to each other in the densely built city centre
  • Location Plantentuin represents a small park
  • Location Honda is situated in the port of Ghent
  • Location Wondelgem represents a typical suburban neighbourhood at the northwestern border of the city
  • Location Melle is situated southeast of Ghent and is used as a rural reference location
The figure below shows the evolution of the 2m temperature (average over 5 minutes). The temperature is measured in an actively ventilated radiation screen that shields the sensor from direct sunlight and provides ventilation. On calm clear nights the urban heat island effect will be clearly visible in the lower temperatures measured at location Melle .

Urban Heat Temperature Graph
The time is given in UT, for the local time you need to add 2 hours (summer) or 1 hour (winter). Be careful, these are realtime data that are not quality controlled.
Below the relative humidity (average over 5 minutes) is shown. This property depends both on the amount of moisture present and the air temperature.
Urban Heat Humidity Graph
The time is given in UT, for the local time you need to add 2 hours (summer) or 1 hour (winter). Be careful, these are realtime data that are not quality controlled.
The wind direction (average over 5 minutes) is expressed as the deviation in degrees from the north direction (e.g. 90 degrees = wind from the east, 180 degrees = wind from the south,...). The anemometers are installed at a height of 2 meter. The complex flow around buildings makes that the wind direction in the city will deviate from the large scale wind direction. At low wind speeds (< 3 m/s) there will be no clear wind direction.
Urban Heat Wind Direction Graph
The time is given in UT, for the local time you need to add 2 hours (summer) or 1 hour (winter). Be careful, these are realtime data that are not quality controlled.
Buildings significantly reduce the wind speed (average over 5 minutes) over the city.
Urban Heat Wind Speed Graph
The time is given in UT, for the local time you need to add 2 hours (summer) or 1 hour (winter). Be careful, these are realtime data that are not quality controlled.>
Below the daily accumulated precipitation (expressed in mm) is presented.
Urban Heat Rain Graph
The time is given in UT, for the local time you need to add 2 hours (summer) or 1 hour (winter). Be careful, these are realtime data that are not quality controlled.
The map below shows the 2m temperature (average over 5 minutes) at this moment in Gent. The temperature is measured in an actively ventilated radiation screen that shields the sensor from direct sunlight and provides ventilation. On calm clear nights the urban heat island effect will be clearly visible in the lower temperatures measured at location Melle just outside the city.

Gent Temp Map
The time is given in UT, for the local time you need to add 2 hours (summer) or 1 hour (winter). Be careful, these are realtime data that are not quality controlled.
Buildings reduce the wind speed (average over 5 minutes) over the city. The map below shows the current wind speed measured at 2m height (expressed at the Beaufort scale).

Gent Wind Map
The time is given in UT, for the local time you need to add 2 hours (summer) or 1 hour (winter). Be careful, these are realtime data that are not quality controlled.
Below the accumulated precipitation (expressed in l/m^2) since midnight is presented.

Gent Rain Map
The time is given in UT, for the local time you need to add 2 hours (summer) or 1 hour (winter). Be careful, these are realtime data that are not quality controlled.